Canadian data · Adults age 65 and older
In 2022, 7,621 Canadians age 65 and older died from falls. In 2023/24, another 81,599 fall-related hospitalizations were recorded outside Quebec. This research page brings the latest national figures together without hiding the different years, definitions or geographic gaps behind them.[1], [6]
This 2026 edition uses PHAC’s national data blog, updated November 28, 2025, together with the agency’s peer-reviewed analysis containing hospital and emergency-department data through 2023/24. It also draws on PHAC’s detailed surveillance report and the original health-system data sources.
Last reviewed: August 10, 2026 · Newest outcomes: deaths (2022); hospitalizations and emergency visits (2023/24)
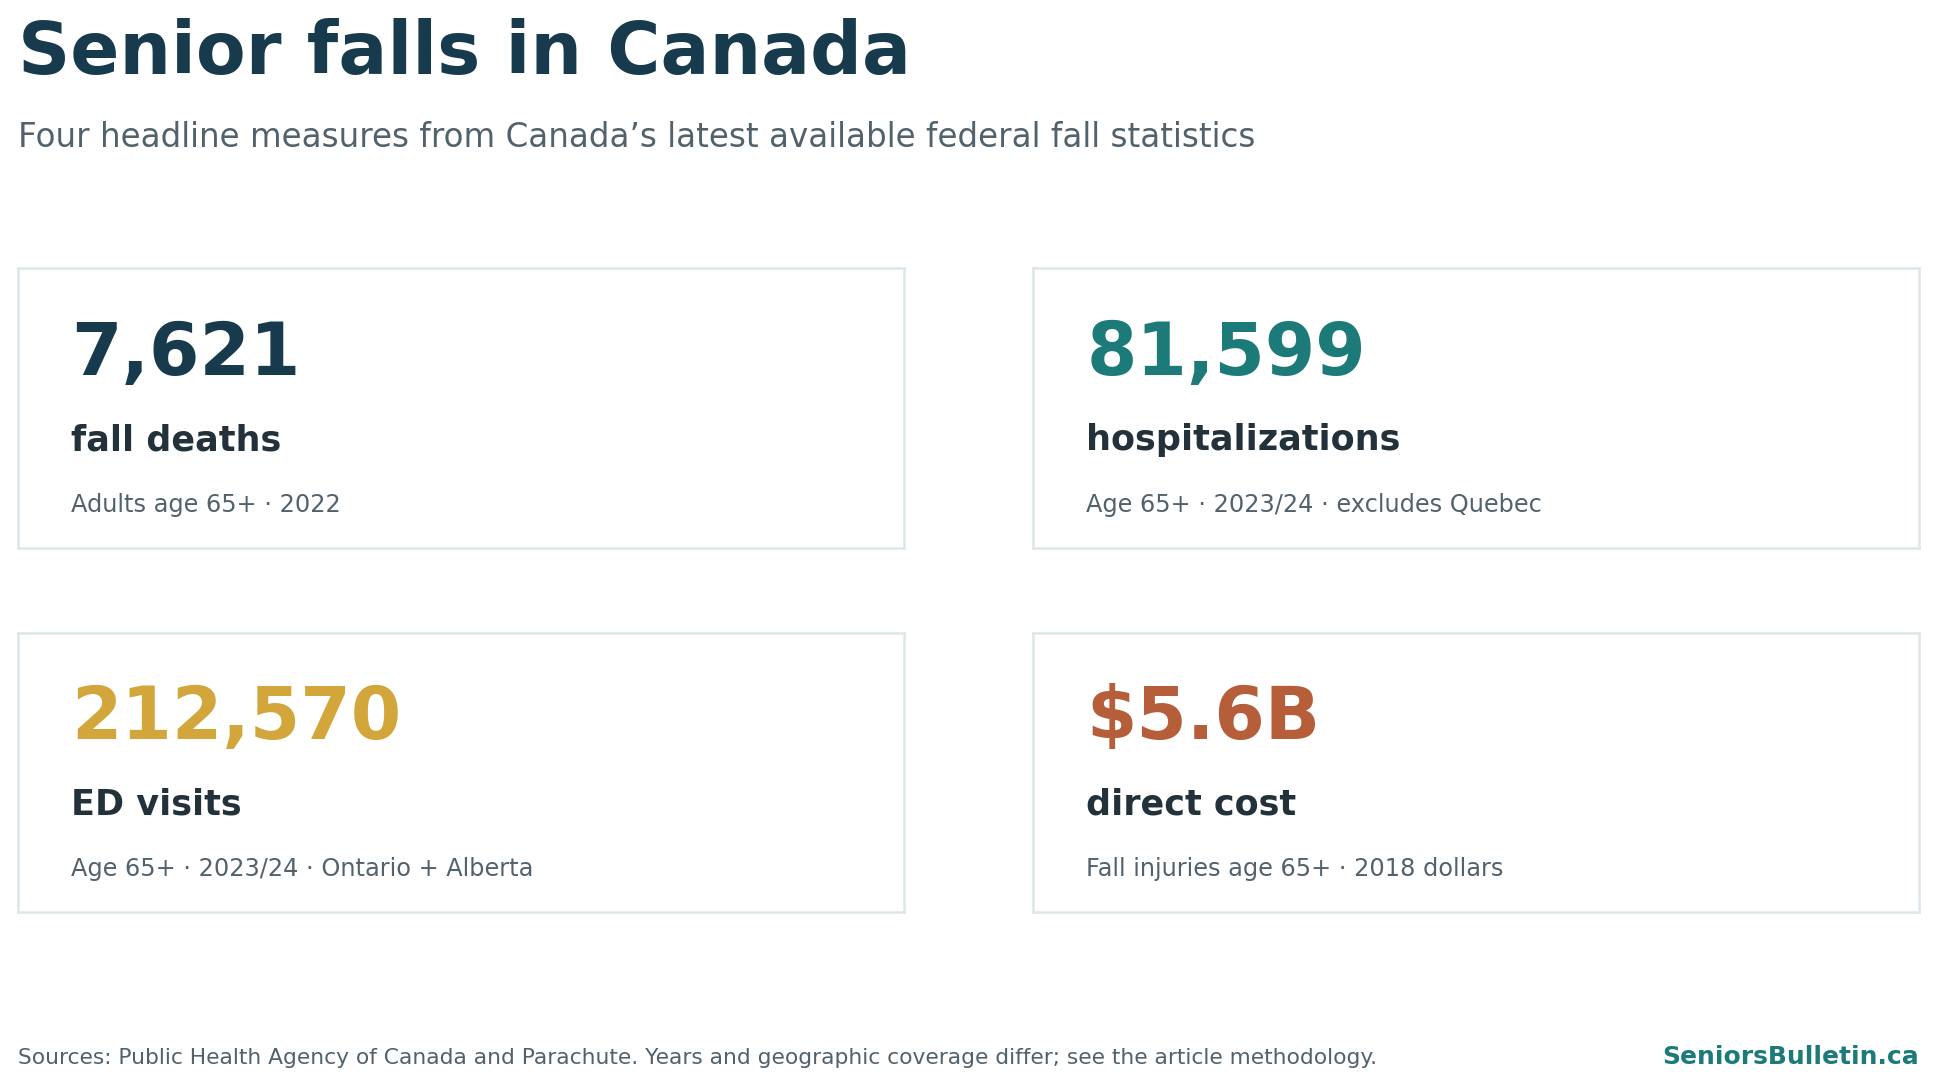
Key Canadian senior fall statistics
Source and scope for every figure are documented in the sections below.[1], [2], [3], [6]
Canadian senior falls: the data snapshot
There is no single database that counts every fall experienced by every older Canadian. Death certificates, hospital records, emergency department records and household surveys each capture a different part of the problem. The cleanest comparison is therefore a source map—not one blended total.
| Measure | Latest period used | Published count or rate | Coverage and key limitation |
|---|---|---|---|
| Deaths due to falls | 2022 | 7,621 deaths | Canada; adults age 65+ |
| Fall-related hospitalizations | 2023/24 | 81,599 hospitalizations | Canada excluding Quebec; episodes of acute care |
| Fall-related emergency visits | 2023/24 | 212,570 visits | Ontario and Alberta only; not a Canada-wide total |
| Self-reported serious fall injury | 2017–18 | 5.8% (about 350,000 people) | Household population; excludes institutional residents and less serious falls |
| Direct economic cost | 2018 | $5.6 billion | Canada; direct cost estimate in 2018 dollars |
Important: these figures should not be added together. One fall can generate an emergency visit and a hospitalization, and each source uses its own definition, period and geographic coverage.
How common are falls among Canadian seniors?
The best national self-reported estimate is about 350,000 older adults, or 5.8% of the household population age 65 and older, reporting a serious fall-related injury during the previous 12 months in the 2017–18 Canadian Community Health Survey.[2]
This is an injury statistic, not the percentage of older adults who fell at all. The survey counted an injury only when it was serious enough to limit normal activities the day after it occurred, and it collected details only about the respondent’s most serious injury. It excluded people living in institutions, including residential care. Falls without a qualifying injury were not included.
Citation-ready wording
In the 2017–18 Canadian Community Health Survey, 5.8% of community-dwelling Canadians age 65 and older—about 350,000 people—reported a serious fall-related injury in the previous year. The estimate does not represent all falls and excludes institutional residents.
Among respondents, the prevalence was 6.5% for women and 5.0% for men. PHAC also found a higher prevalence among older age groups and people living alone. These are associations in cross-sectional survey data; they do not establish that any single characteristic caused a fall.[2]
Deaths due to falls among Canadians age 65+
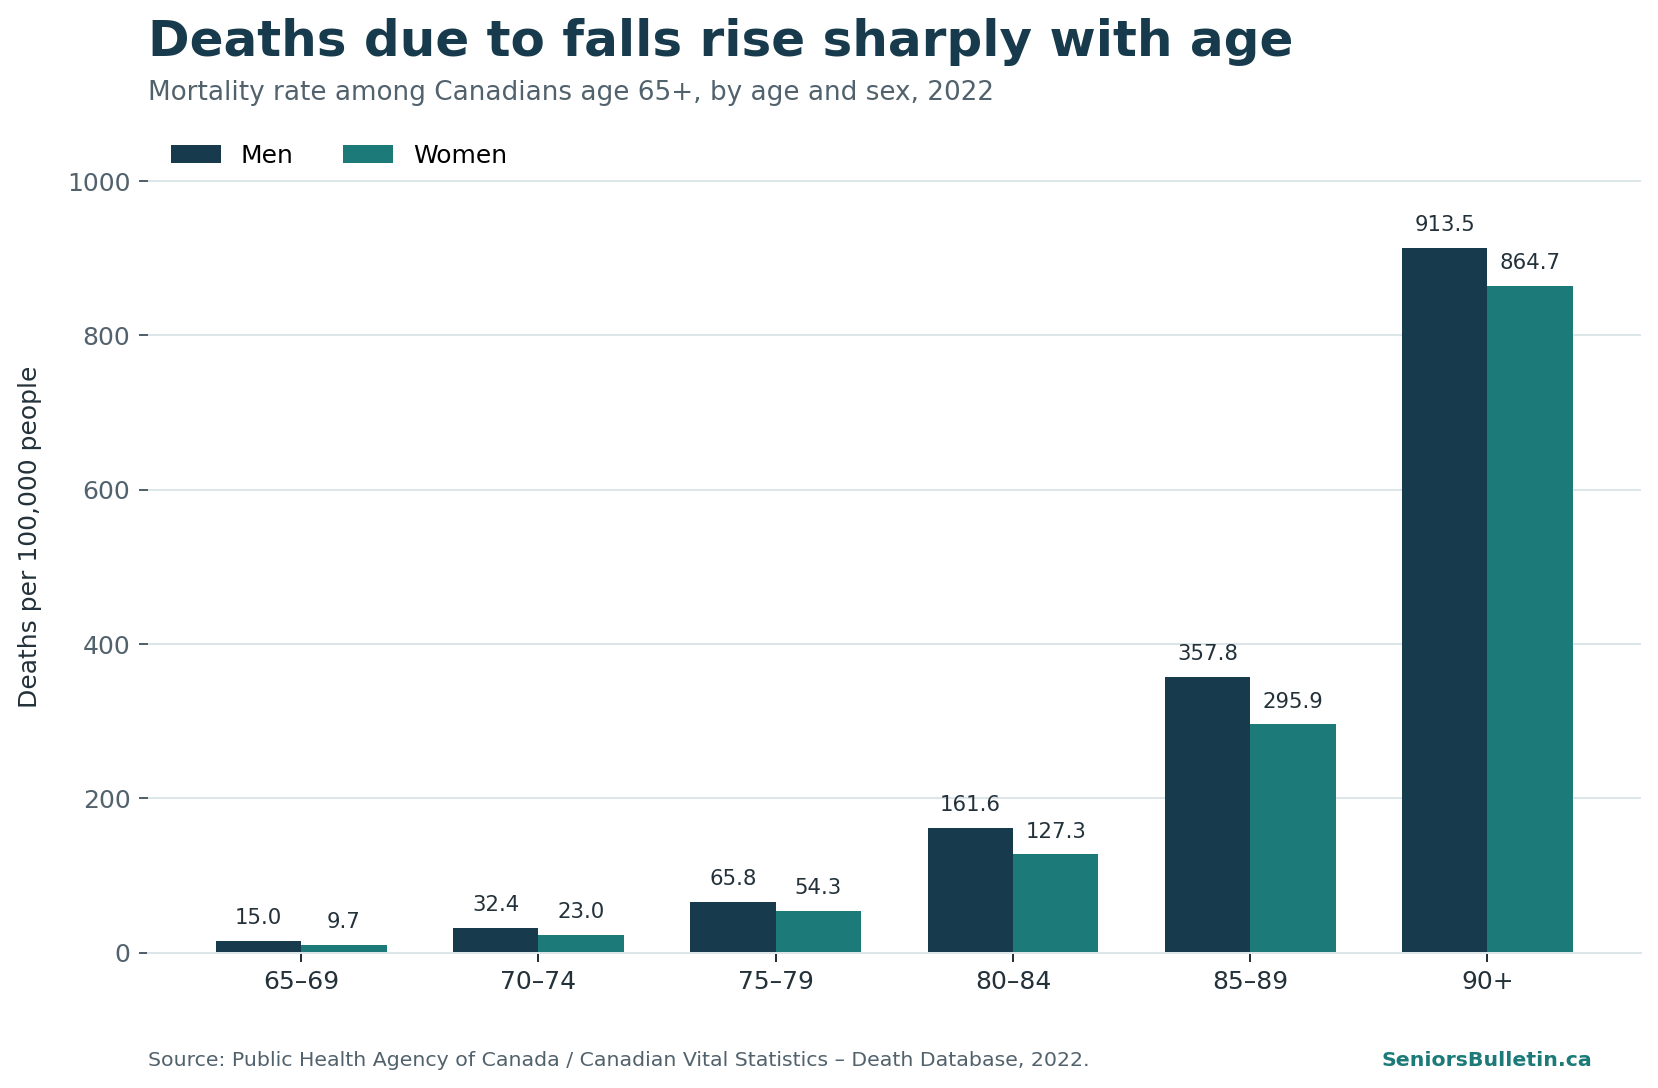
Falls caused 7,621 deaths among Canadians age 65 and older in 2022, according to PHAC’s November 2025 national data update. Women accounted for 4,349 deaths and men for 3,272.[1]
Age is the clearest pattern in the mortality data. The reported death rate rose from 15.0 per 100,000 men and 9.7 per 100,000 women at ages 65–69 to 913.5 and 864.7, respectively, at age 90 and older. That is a rate increase of more than fiftyfold across those age groups.
| Age | Men: deaths | Women: deaths | Men: rate per 100,000 | Women: rate per 100,000 |
|---|---|---|---|---|
| 65–69 | 168 | 115 | 15.0 | 9.7 |
| 70–74 | 290 | 224 | 32.4 | 23.0 |
| 75–79 | 425 | 395 | 65.8 | 54.3 |
| 80–84 | 628 | 620 | 161.6 | 127.3 |
| 85–89 | 763 | 931 | 357.8 | 295.9 |
| 90+ | 998 | 2,064 | 913.5 | 864.7 |
| All 65+ | 3,272 | 4,349 | 97.1 | 110.7 |
Source: Statistics Canada, Canadian Vital Statistics–Death Database, as reported by PHAC. Sex categories and rates are reproduced as published.[1]
Did deaths from falls increase?
Yes. PHAC reports that deaths due to falls among adults age 65 and older increased 51% between 2017 and 2022, from 4,752 to 7,182 in its trend series. That series excludes Yukon.[1]
Why does the 2022 trend endpoint say 7,182 while the 2022 national table says 7,621? PHAC publishes both figures on the same data page: 7,182 is the endpoint of its Yukon-excluded trend series, while 7,621 appears in the separate 2022 age-and-sex table. PHAC’s peer-reviewed paper reports 7,189 for the preliminary Yukon-excluded 2022 series. The later data blog does not reconcile the remaining difference, so we preserve each figure in its published context and do not use them interchangeably.[1], [6]
A higher death count can reflect population growth, a larger share of people in the oldest age groups, changes in fall risk and other factors. Counts alone cannot show how much each factor contributed. PHAC’s earlier surveillance work found that both crude and age-standardized fall mortality rates increased from 2001 to 2019, indicating that population aging was not the only influence during that earlier period.[2]
There were 81,599 fall-related hospitalizations among adults age 65 and older in 2023/24. The Canadian Institute for Health Information (CIHI) hospitalization database used for this estimate excludes Quebec, so it is not a complete all-province count.[4], [6]
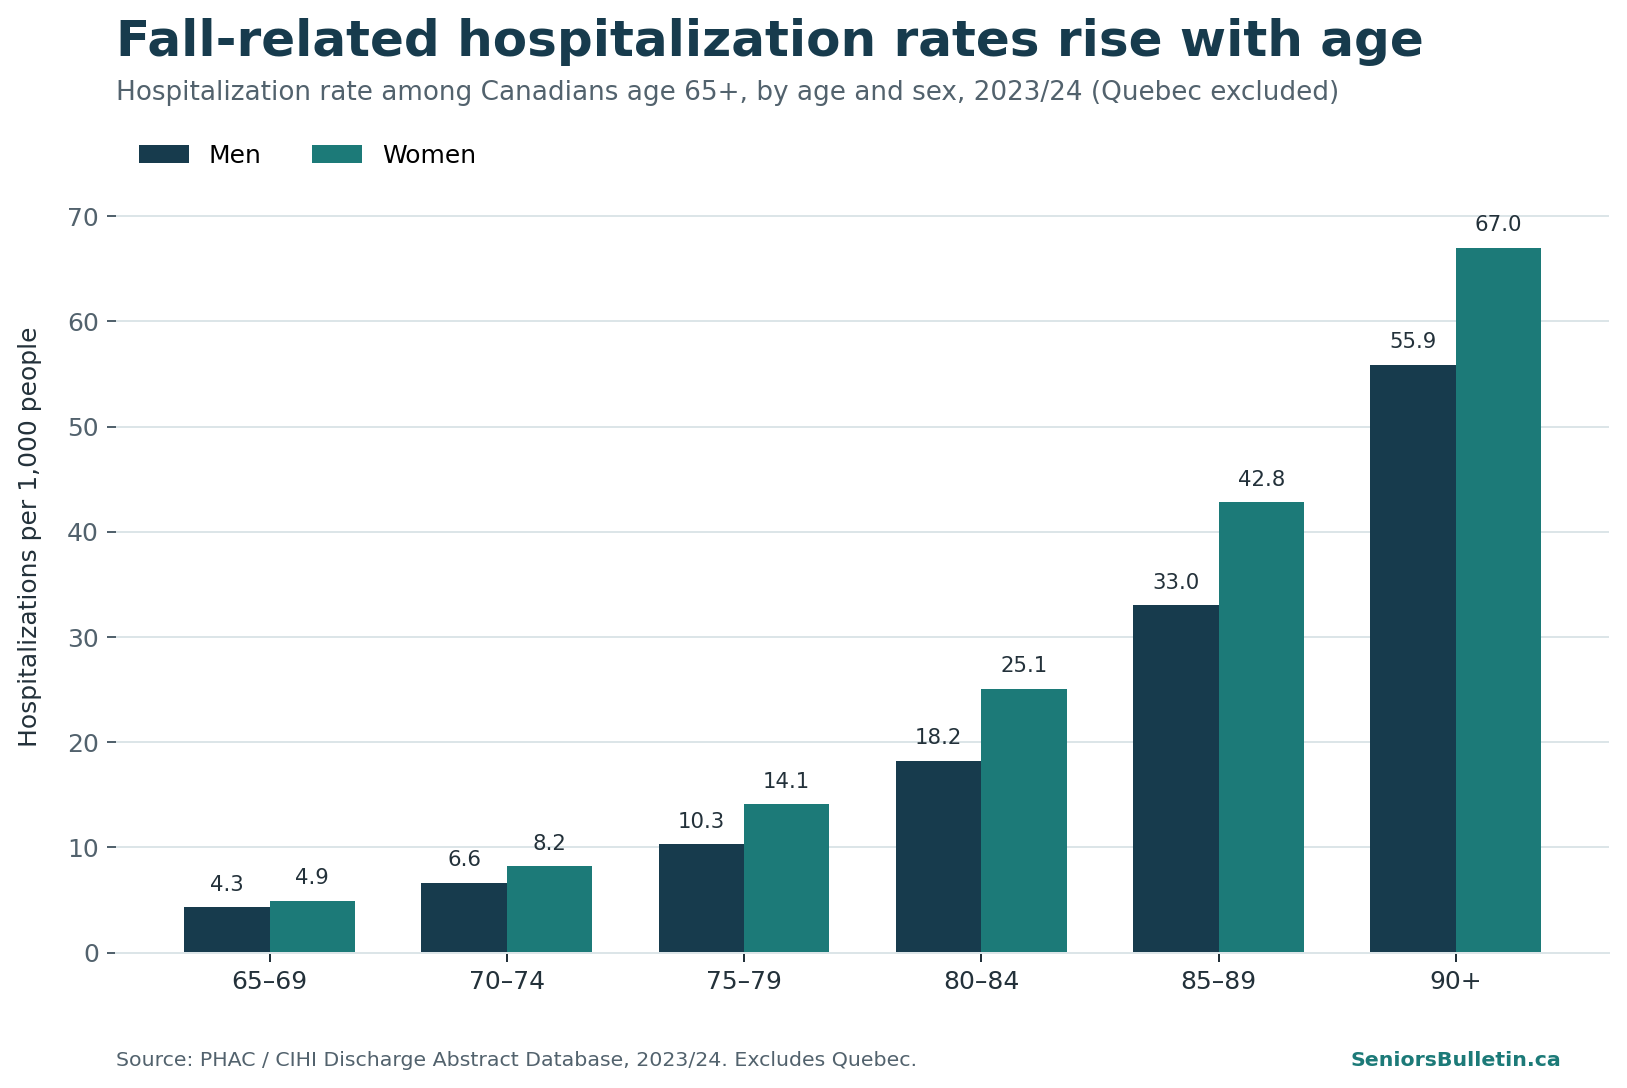
Women accounted for 51,585 hospitalizations—nearly two-thirds of the total—while men accounted for 30,014. Rates increased at each successive age group and were consistently higher among women.
| Age | Men: hospitalizations | Women: hospitalizations | Men: rate per 1,000 | Women: rate per 1,000 |
|---|---|---|---|---|
| 65–69 | 3,771 | 4,653 | 4.3 | 4.9 |
| 70–74 | 4,568 | 6,269 | 6.6 | 8.2 |
| 75–79 | 5,395 | 8,305 | 10.3 | 14.1 |
| 80–84 | 5,669 | 9,681 | 18.2 | 25.1 |
| 85–89 | 5,634 | 10,441 | 33.0 | 42.8 |
| 90+ | 4,977 | 12,236 | 55.9 | 67.0 |
| All 65+ | 30,014 | 51,585 | 11.3 | 16.6 |
Source: CIHI Discharge Abstract Database, as analyzed by PHAC. Figures exclude Quebec and use episodes of care rather than simply counting every transfer as a new case. Rates are rounded to one decimal here.[6]
For 2022/23, PHAC’s current data blog reports 78,076 fall-related hospitalizations. Falls represented 89% of all injury-related hospitalizations in this age group, and 34%, or 26,848 hospitalizations, involved a hip fracture. PHAC’s detailed surveillance report also found that hospital stays involving a hip fracture averaged about three days longer than fall hospitalizations without one.[1], [2]
Citation-ready wording
Canada recorded 81,599 fall-related hospitalizations among adults age 65 and older in 2023/24, excluding Quebec. In PHAC’s 2022/23 summary, falls accounted for 89% of injury-related hospitalizations in this age group, and 34% of fall hospitalizations involved a hip fracture.
Hospitalization counts grew, while long-term rates were broadly stable
From 2010/11 to 2023/24, the number of fall-related hospitalizations rose 53%, from 53,347 to 81,599. The crude rate in 2023/24 was 14.1 per 1,000 older adults. PHAC’s peer-reviewed analysis found that the overall long-term trend in hospitalization rates did not increase, despite year-to-year changes and a pandemic-era dip. The growing count is therefore likely driven largely by the aging population. A larger count should not automatically be described as a higher individual risk.[6]
CIHI recorded 212,570 fall-related emergency department visits among adults age 65 and older in Ontario and Alberta in 2023/24. Women accounted for 134,359 visits and men for 78,211.[5], [6]
This should always be labelled as a two-province figure. It is substantial, but it is not an estimate for all of Canada.
| Age | Men: visits | Women: visits | Men: rate per 1,000 | Women: rate per 1,000 |
|---|---|---|---|---|
| 65–69 | 14,711 | 22,850 | 26.8 | 38.8 |
| 70–74 | 14,051 | 22,440 | 33.0 | 47.2 |
| 75–79 | 14,613 | 23,641 | 45.4 | 64.2 |
| 80–84 | 13,347 | 22,472 | 68.7 | 92.5 |
| 85–89 | 11,786 | 20,857 | 109.1 | 133.5 |
| 90+ | 9,703 | 22,099 | 170.7 | 187.9 |
| All 65+ | 78,211 | 134,359 | 47.2 | 68.9 |
Source: CIHI National Ambulatory Care Reporting System, as analyzed by PHAC. Coverage is Ontario and Alberta only. Rates are rounded to one decimal here.[6]
How injurious falls happen—and what they injure
The 2017–18 household survey gives context that hospital and death records cannot: what people were doing, what part of the body was hurt and whether they sought care. These figures refer only to each respondent’s most serious fall-related injury.
Activity when the fall occurred
- 61% occurred while walking
- 43% occurred while walking on surfaces other than ice or snow
- 18% occurred while walking on ice or snow
- 12% occurred on stairs or steps
Most common injury types
- 39% fractures
- 27% sprains or strains
- 14% scrapes, bruises or blisters
Body parts most often injured
- 15% shoulder or upper arm
- 13% knee or lower leg
- 12% ankle or foot
- 11% head
Medical attention
- 70% sought medical attention
- Among those who sought care, 72% were treated in an emergency department
- 30.2% did not receive professional medical attention within 48 hours
Source: 2017–18 Canadian Community Health Survey, household population age 65+, as analyzed by PHAC.[2]
Walking accounts for the largest share because it includes many environments and is a frequent daily activity. The figures do not prove that walking itself is unusually dangerous. They do show why prevention has to address both personal factors—such as strength, balance, vision and medication effects—and environmental factors such as lighting, ice, clutter, railings and bathroom supports.
The cost and health-system burden of senior falls
Falls among Canadians age 65 and older generated an estimated $5.6 billion in direct costs in 2018. Parachute’s Cost of Injury in Canada report estimates that falls across all ages cost $10.3 billion in that year, making falls the country’s costliest injury cause. The $5.6 billion figure is historical and should be cited as a 2018 estimate, not as a current-dollar amount.[3]
Fall admissions also use more hospital time. PHAC’s latest summary says fall-related stays for adults over 65 typically last nine days longer than an average hospital stay. The underlying surveillance analysis separated that difference into an additional 5.2 days in acute care and 4.1 days at alternate level of care during the study period.[1], [2]
Citation-ready wording
Falls among Canadians age 65 and older were estimated to generate $5.6 billion in direct costs in 2018. Fall-related hospital stays also typically lasted nine days longer than the average stay for people over 65.
Fall prevention and safer aging at home
PHAC is clear that falls can be prevented, but prevention is rarely one product or one change. A useful plan considers mobility and balance, strength, vision, medications, footwear, nutrition, sleep, home hazards and the activities a person performs every day. A healthcare professional can help assess personal risks; an occupational therapist can assess how the home environment and daily routines interact with them.
Start with everyday risks
- Review medications and vision with qualified professionals.
- Choose strength and balance activities appropriate to the individual.
- Improve lighting and keep walking routes clear.
- Address loose rugs, cords, snow, ice and unsuitable footwear.
- Add secure handrails or grab bars where an assessment identifies a need.
Plan for the home and for help
- Use our practical fall-prevention guide for older adults to review common risks.
- Know the immediate and longer-term concerns after a fall.
- For someone who may need to call for help, compare medical alert systems available in Canada.
- Build a broader plan with our guide to aging in place in Canada.
When home accessibility equipment may help
Equipment should respond to a specific need identified in the person and the home. Where stairs are a recurring barrier, families can learn how stair lifts compare in Canada. Where bathing access is the problem, our walk-in tub guide explains features and trade-offs. For multi-level homes where a lift is being considered, see our comparison of Canadian home elevator options.
These devices do not remove every fall risk. Medical alerts are designed to help someone summon assistance after an incident; they do not prevent a fall, and automatic fall detection cannot identify every event. Stair lifts, tubs and elevators also require appropriate selection, installation and safe use.
Methodology, definitions and limitations
This page prioritizes original Canadian sources and preserves their published scope. PHAC’s current data blog supplies the revised 2022 mortality table and 2022/23 hospitalization measures such as the 89% injury share and hip-fracture count. PHAC’s peer-reviewed 2024 analysis supplies the newer 2023/24 hospitalization and emergency-visit totals and age breakdowns. Its detailed 2022 surveillance report supplies survey definitions and additional context. Parachute supplies the 2018 cost estimate.
| Dataset | What is counted | Key exclusions or cautions |
|---|---|---|
| Canadian Vital Statistics–Death Database | Deaths due to falls, identified with ICD-10 codes W00–W19 | The 2017–2022 trend displayed by PHAC excludes Yukon; mortality data capture deaths coded to falls, not every death where a fall may have contributed |
| CIHI Discharge Abstract Database | Acute-care episodes involving an injury diagnosis and an unintentional-fall code | Excludes Quebec; does not include less severe cases treated elsewhere or without care |
| CIHI National Ambulatory Care Reporting System | Emergency visits with an unintentional-fall code | The published 2023/24 totals on this page cover Ontario and Alberta only |
| Canadian Community Health Survey | Self-reported fall injury serious enough to limit normal activities the next day; most serious injury only | 2017–18 household population; excludes institutional residents and other CCHS-excluded populations |
| Cost of Injury in Canada | Modelled direct health-system cost attributable to falls | 2018 estimate; not adjusted here to 2026 dollars |
How we calculated and checked the page
- Counts and rates in the age-and-sex tables are transcribed from PHAC’s accessible figure descriptions.
- The total 2022 death count equals the published sex totals: 3,272 men plus 4,349 women.
- The 2023/24 hospitalization total equals 30,014 men plus 51,585 women.
- The 2023/24 Ontario-and-Alberta emergency total equals 78,211 men plus 134,359 women.
- No national total was estimated from partial-province data.
- No inflation adjustment was applied to the 2018 cost estimate.
Terminology note: the source tables report “men” and “women.” We retain those labels because the underlying published data do not provide a separate gender-diverse category. “Senior” is used here for search clarity; the statistical population is adults age 65 and older.
Source-revision note: PHAC’s November 2025 data blog reports 78,076 hospitalizations and 200,825 emergency visits for 2022/23. Its peer-reviewed paper published in November 2024 reports 77,170 and 200,823 for the same period and labels 2019–2022 mortality data preliminary. Small differences can occur when administrative or vital-statistics data are revised. We use the later blog values for its 2022/23 measures and the paper’s newer 2023/24 values for the current headline counts.
Download and cite the data
Download the structured source table used for this page. Each row includes the data year, population, geography, unit, exclusion and original source URL so writers and researchers can retain the necessary context.
Download the CSV View original sources
Suggested citation: Seniors Bulletin. “Senior Fall Statistics in Canada (2026).” Updated August 10, 2026. Data compiled from the Public Health Agency of Canada, Statistics Canada, CIHI and Parachute.
Our original charts may be reused with visible attribution to Seniors Bulletin and a link to this page. The underlying statistics remain attributable to their original sources.
Frequently asked questions
How many Canadian seniors fall each year?
Canada does not have one current database counting every fall. In the 2017–18 Canadian Community Health Survey, 5.8% of household residents age 65 and older—about 350,000 people—reported a serious fall-related injury in the previous 12 months. That figure excludes falls without a qualifying injury and people living in institutions, so it should not be described as the percentage who experienced any fall.
How many Canadian seniors die from falls?
In 2022, 7,621 Canadians age 65 and older died from falls, according to the latest national PHAC data update available when this page was reviewed. The total included 4,349 women and 3,272 men.
Are falls the leading cause of injury hospitalization for older Canadians?
Yes. PHAC reports that falls caused 89% of injury-related hospitalizations among adults age 65 and older in 2022/23. The hospitalization database excludes Quebec.
Are older women or older men more affected by falls?
It depends on the measure. Women had more deaths, hospitalizations and emergency visits in the latest published tables. Hospitalization and emergency-visit rates were also higher for women in every age group. For mortality, however, men had higher rates within every published five-year age band, while women had the higher aggregate 65+ rate and death count. Age distribution matters when interpreting the broad total.
Where do injurious falls most often happen?
PHAC’s household survey found that 61% of serious fall-related injuries happened while walking: 43% while walking on surfaces other than ice or snow and 18% on ice or snow. Another 12% occurred while using stairs or steps. These activity figures do not identify a single location for every fall.
What is the most common injury from a senior fall?
Fractures were the most frequently reported injury type, accounting for 39% of serious fall-related injuries in the 2017–18 household survey. In 2022/23 hospital data excluding Quebec, 34% of fall-related hospitalizations among adults age 65 and older involved a hip fracture.
How much do senior falls cost Canada?
Falls among adults age 65 and older were estimated to generate $5.6 billion in direct costs in 2018. This is a historical 2018-dollar estimate from Parachute’s Cost of Injury in Canada report, not a 2026-dollar estimate.
Can falls among older adults be prevented?
Many falls are preventable. Effective prevention is usually multifactorial and may include an individualized health and medication review, suitable strength and balance activity, vision care, safer footwear, and changes to hazards or access barriers in the home and community. A qualified health professional can help tailor the approach.
Original sources
- Public Health Agency of Canada: Falls among older adults in Canada—Data blog. Published November 2025; last updated November 28, 2025. Revised 2022 mortality and 2022/23 hospitalization and emergency-visit statistics.
- Public Health Agency of Canada: Surveillance report on falls among older adults in Canada. Published March 2022. Detailed survey definitions, trends, injury characteristics and methodology.
- Parachute: Cost of Injury in Canada. Published 2021 using 2018 data. Direct and total cost estimates by cause and age.
- Canadian Institute for Health Information: Discharge Abstract Database metadata. Source database for hospitalization records.
- Canadian Institute for Health Information: National Ambulatory Care Reporting System metadata. Source database for emergency-department records.
- Yao et al.: Temporal trends and characteristics of fall-related deaths, hospitalizations and emergency department visits among older adults in Canada. Peer-reviewed PHAC journal article published November 2024, with hospitalization and emergency-visit data through 2023/24.
- Statistics Canada: Canadian Vital Statistics–Death Database. Underlying national mortality database used by PHAC.
Editorial note: This page is for general information and statistical reference. It is not medical advice and does not replace assessment by a qualified healthcare professional. If a fall may have caused an emergency, contact emergency services.